Floor Plan Heatmap for Tridium Niagara
The Floor Plan Heatmap for Tridium Niagara renders a continuous, interpolated thermal field over your own floor plan from live sensor readings. Instead of staring at a list of point values or a grid of coloured polygons, operators see one picture of the building: where it is hot, where it is cold, and where a sensor disagrees with its neighbours. The widget is designed first and foremost for data centres – where a single coherent thermal picture is the difference between catching a hot spot the moment it forms and finding it after a server has thermal-throttled – but the same engine applies anywhere a scalar field is sampled by a network of sensors over a known geometry.
The widget closes a gap that has sat open in the building-automation market for years. Dedicated DCIM platforms ship thermal visualisation but cost tens of thousands of pounds per year and run as a separate system alongside your BMS. Pharma validation systems ship deep compliance tooling but are scoped to a single vertical. BMS-native heatmaps on the market today colour discrete zones with a min / optimal / max scale – useful, but not the smooth interpolated picture that an operator actually wants. The Floor Plan Heatmap delivers interpolated thermal visualisation at BMS-widget pricing, native to Niagara, with no parallel platform to license, integrate, or maintain.
Configuration is deliberately simple. Add your floor plan to a Niagara graphic and drop the Heatmap widget on top of it. Add a sensor point for each measurement, bind it to the Niagara point that delivers the value, and set its X and Y coordinates in the property sheet – the marker appears on the graphic immediately at the configured position. Once configured, the widget streams live values and redraws on every update from the bound points, all rendered in the browser through WebGL with no load on the JACE.
Applications
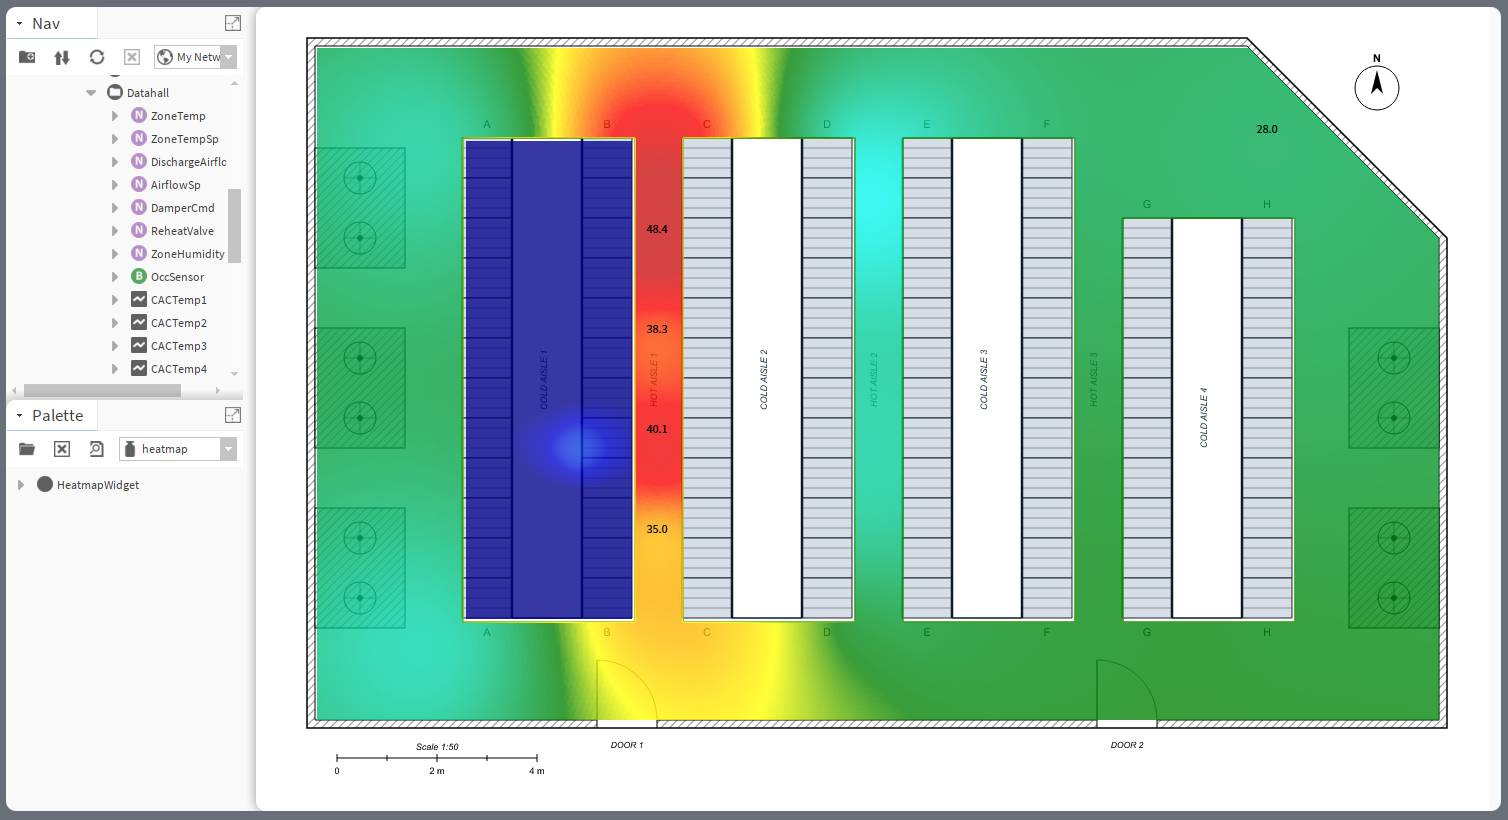
Data centres are the primary application. A modern data hall has hundreds of sensors – rack inlet, exhaust, ambient, perimeter, CRAC return – and operators want one floor-level picture rather than a wall of tabular point values. The widget can render rack inlet temperatures across the cold aisles, exhaust temperatures across the hot aisles, or ambient floor temperatures, each tuned to its own band against the ASHRAE TC 9.9 thermal guidelines. It applies equally to colocation halls, hyperscale rooms, edge sites, and the small server rooms inside enterprise buildings.
Beyond data centres the same engine fits any environment where a scalar field is sampled by a sensor network over a known geometry:
- Cold storage and food distribution – freezer rooms, cold rooms, anterooms, blast freezers, and loading docks. Identifies thermal stratification near doors and dock seals. Supports HACCP and Good Distribution Practice (GDP) monitoring of cold chain integrity.
- Pharmaceutical cleanrooms and storage – thermal uniformity mapping for GxP environments, stability rooms, vaccine cold-chain rooms, and controlled-temperature warehouses. Defensible visualisation for environmental monitoring under 21 CFR Part 11 and EU GMP Annex 11.
- Healthcare facilities – operating theatres, neonatal units, isolation rooms, MRI suites, pharmacy storage, and ward HVAC where comfort and infection control depend on uniform thermal conditions.
- Greenhouses and vertical farms – temperature, humidity, and light intensity across crop compartments with different setpoints (tomato versus lettuce versus strawberry, propagation versus finishing).
- Manufacturing and process industries – heat distribution around furnaces, kilns, ovens, drying tunnels, cooling plant rooms, and battery cell production lines.
- Office buildings and retail – comfort zone monitoring, CO2 distribution, PMV / PPD mapping across tenant floors and shared concourses.
- Museums, archives, and wine cellars – tight temperature and humidity uniformity for long-term preservation of paintings, manuscripts, film, and stored wines.
- Indoor car parks, tunnels, and underground stations – CO and CO2 stratification, jet-fan ventilation effectiveness, and smoke control commissioning.
- Battery energy storage systems (BESS) – thermal monitoring of cell banks, inverter rooms, and battery cabinets for early detection of thermal-runaway risk.
- Indoor swimming pools and leisure centres – combined temperature and relative humidity uniformity, dew-point management against fabric condensation.
Tridium Niagara is the open framework that already connects to the sensors. Most buildings – and almost every modern data hall – already collect rack inlet, exhaust, and ambient temperatures into Niagara stations over BACnet, Modbus, or proprietary protocols. The Floor Plan Heatmap takes the data that is already there and gives it a visualisation that finally matches the geometry of the building. The result is one coherent picture, bound to the points you already have, that an operator can read at a glance. Contact us for a free trial or a demo on your own floor plan.
Floor Plan Heatmap Preview
Contact Us
Want to enquire about our products or ask something? Feel free to e-mail us or use this form.