Data Analytics and Visualisation Library for Tridium Niagara
A picture is worth a thousand words, and, certainly when it comes to data, metrics and KPIs, nothing could be more apt. Without visual tools such as charts and graphs we would soon get lost in a sea of numbers being presented to us. With data collection and use continuing to increase exponentially, the need to visualize these data is becoming more important. Engineers seek to consolidate thousands of database records into beautiful charts and dashboards that humans can quickly and intuitively interpret.
Tridium Niagara offers a great platform to collect the data, and it comes with a few easy to use chart types that are sufficient to do a basic visualisation. However, when it comes to large amounts of data and more complex data presentation along with sophisticated dashboards – Baudrate Data Analytics and Visualisation (DAV) library can help.
The library is based on plotly.js, which is an interactive plotting library that supports over 40 unique chart types covering a wide range of statistical, financial, geographic, scientific, and 3-dimensional use-cases. Built on top of d3.js and stack.gl, plotly.js allows users to create beautiful interactive web-based visualisations that now can be displayed in standard Niagara PX files. Every chart type has hundreds of customisations options and almost every aspect of data visualisations can be modified to suit the needs. Plotly offers advanced charting capabilities which are used by leading data science and statistical companies. It allows engineers to put complex data analytics in the hands of business decision makers and operators.
Baudrate DAV library not just allow to insert plotly.js charts in Niagara PX views. It fully integrates all charts with Niagara framework with easy to use configuration UI, adds many ways to bind charts with real-time and historical data, relativize and parameterize charts, maintain consistent views with templates, set and switch time ranges for histories, introduce trend lines and forecasts, produce PDF reports, and much more.
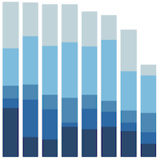
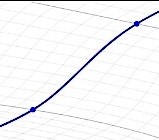
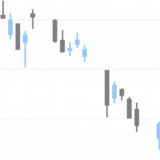
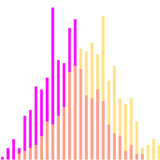
Fundamental charts
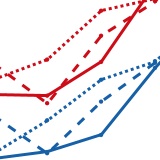
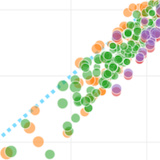
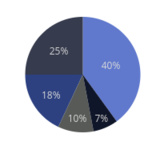
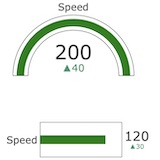
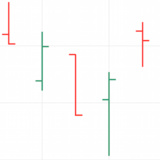
Specialized charts
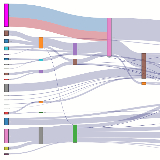
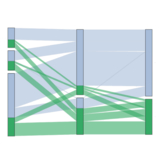
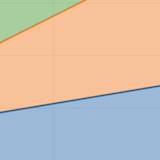
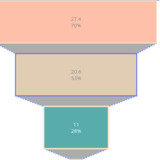
Business charts
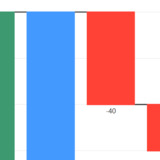
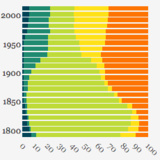
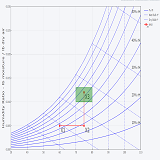
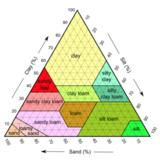
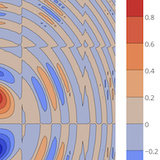
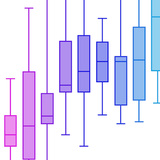
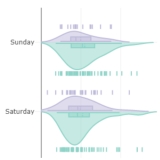
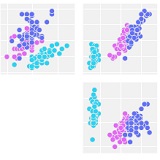
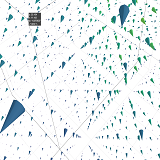
Statistical charts
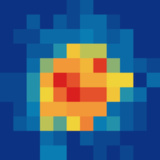
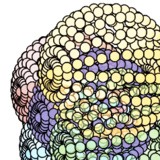
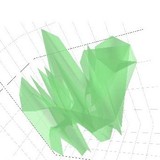
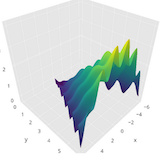
3D charts
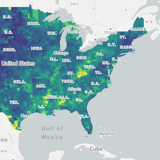
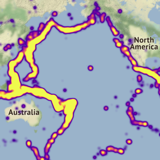
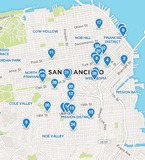
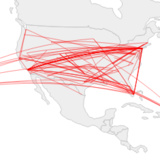
Map charts
Each chart provided by the DAV library is engineered to appear aesthetically pleasing right from the start, with the ability to be tailored using just a handful of attributes. Nonetheless, understanding that a one-size-fits-all approach isn’t always the best fit, these charts allow for significant customization to adhere to client design specifications or to create a distinctive company aesthetic. Therefore, every element of a chart can be personalized. For instance, the scatter plot boasts over 220 unique attributes that determine its appearance. This does not include the additional 1000 (yes, you read that correctly, a thousand!) attributes that manage general chart facets such as margins, fonts, colors, menu buttons, element orientation and positioning, hovertips, data formatting, and so on. Almost all these attributes can be adjusted using native Niagara editors. For example, ‘colorscale’ can be configured using the intuitive point-and-click gradient editor in Niagara.
DAV library charts don’t just look good; they’re interactive as well. Users can employ the mouse and toolbar buttons to zoom, pan, and rotate charts, select time series ranges, export images, and even dispatch the chart configuration to the Chart Studio. This complimentary online tool is ideal for fine-tuning and experimenting with charts. Additionally, it serves as a vast library of charts curated by the Plotly community — a wonderful starting point when in search of inspiration.
Library Overview
DAV Copilot Demo
DAV Startup Demo
Contact Us
Want to enquire about our products or ask something? Feel free to e-mail us or use this form.